
Analytics
Track revenue, orders, refunds, and disputes across your store.
Your analytics dashboard tracks gross volume, net revenue, refund and dispute rates, and orders by country in real time. No setup is required.
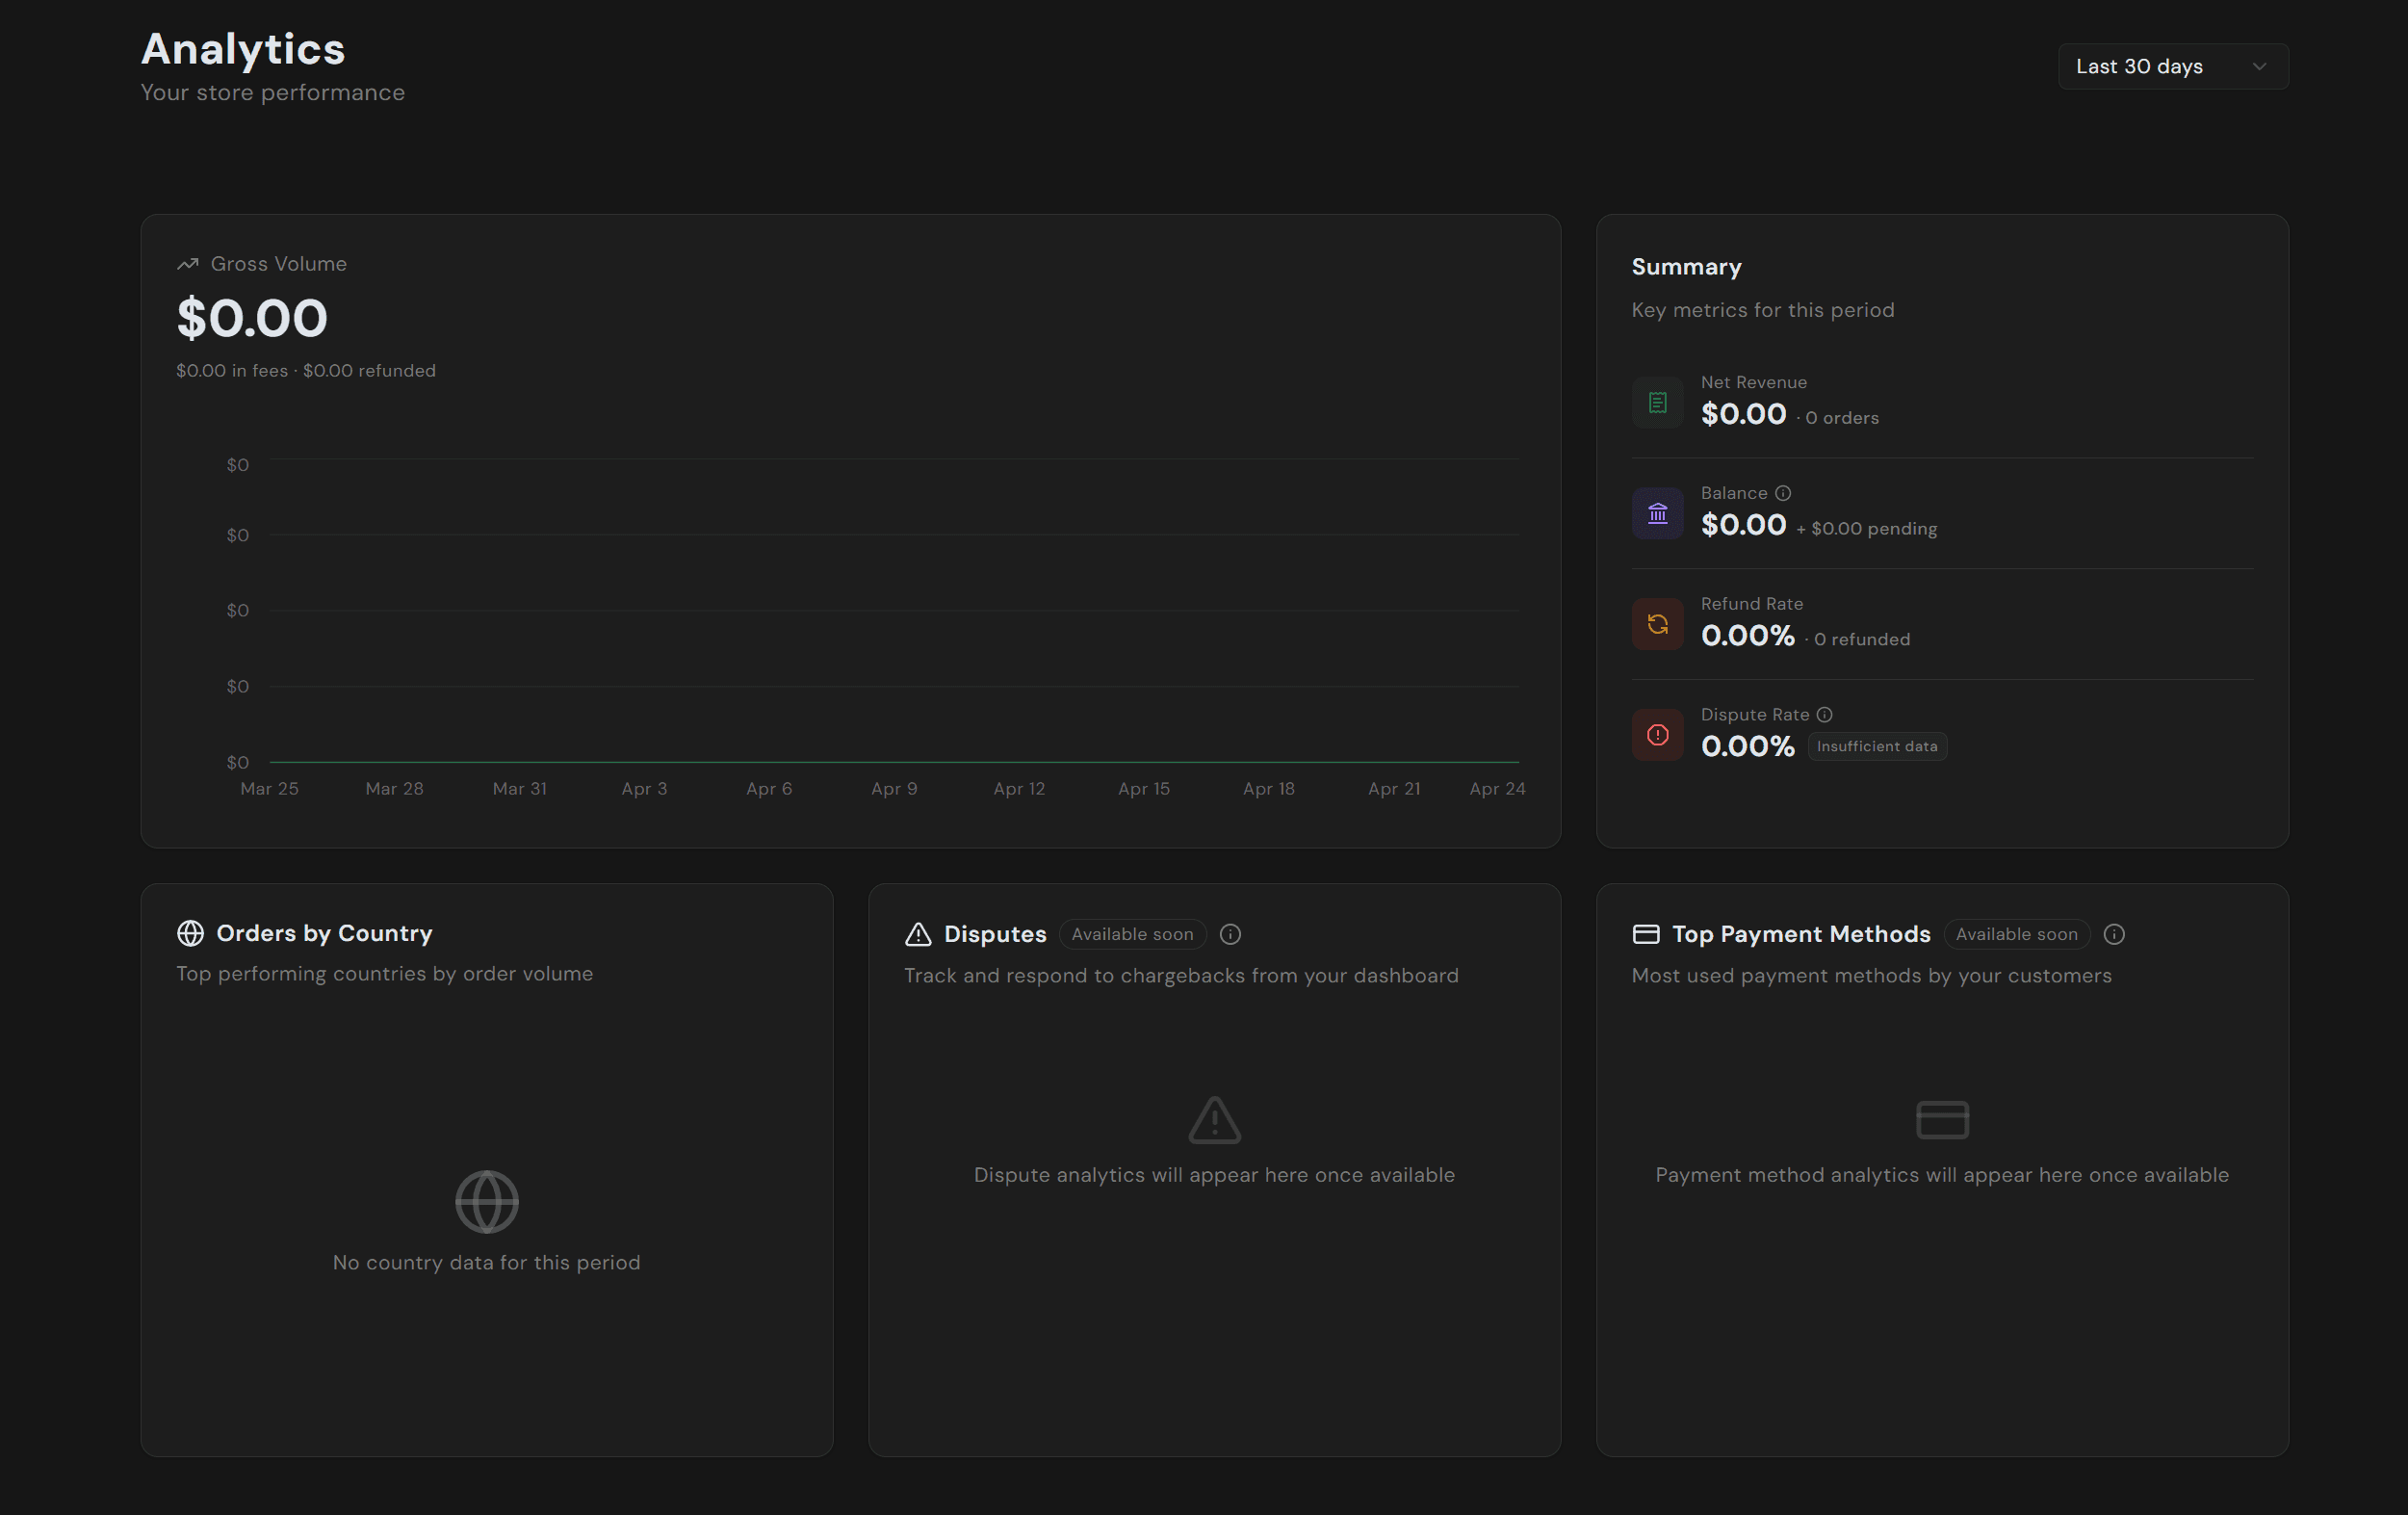
Use the date range selector in the top right to switch between Last 7 days, Last 30 days, Last 90 days, or a custom window.
Gross volume
The main chart shows total payment volume before deductions for the selected period. Fees and refunds appear underneath.
Summary
The summary card on the right shows:
| Metric | What it measures |
|---|---|
| Net Revenue | Gross volume minus fees and refunds, alongside total order count. |
| Balance | Currently available balance plus the amount still in the pending window. |
| Refund Rate | Refunded amount as a percentage of gross volume, with refund count. |
| Dispute Rate | Disputed amount as a percentage of gross volume. Shows "insufficient data" until you have enough volume for the rate to be meaningful. |
Orders by country
See your top countries by order volume for the selected period. Use this to decide which local payment methods and currencies to offer.
Coming soon
These cards will show data when the features are released:
- Disputes. Track and respond to chargebacks directly from the dashboard.
- Top Payment Methods. See which methods (card, Apple Pay, Google Pay, local methods) your customers actually use.